
This document provides a comprehensive guide to navigating Cloud Maven Analytics within Salesforce. It explains how to access the analytics dashboard from a Bank Verification record, details the purpose of each analytics section, and outlines how to configure field visibility and order using Custom Metadata.
1. Purpose
The Cloud Maven Analytics dashboard provides users with insightful financial metrics derived from bank data aggregated through Plaid. It allows users to review calculated financial statistics, statement summaries, categorized transactions, and historical balances for each verified bank account linked to a Bank Verification record.
This feature assists users in understanding a borrower’s financial behavior and trends through automatically calculated analytics, thereby supporting better credit decision-making.
2. Navigating to Cloud Maven Analytics
Follow these steps to access the analytics view for a given Bank Verification record:
Step 1: Open the Bank Verification Record
-
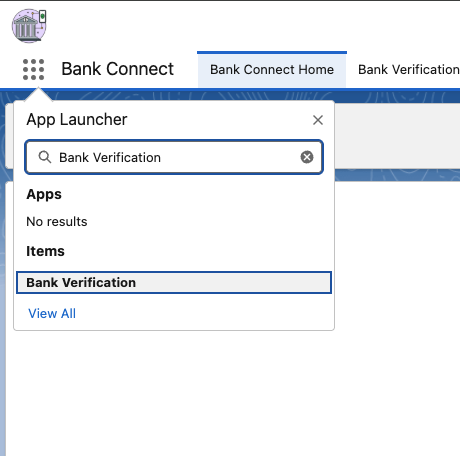
From the Salesforce App Launcher, search for Bank Verification.
-
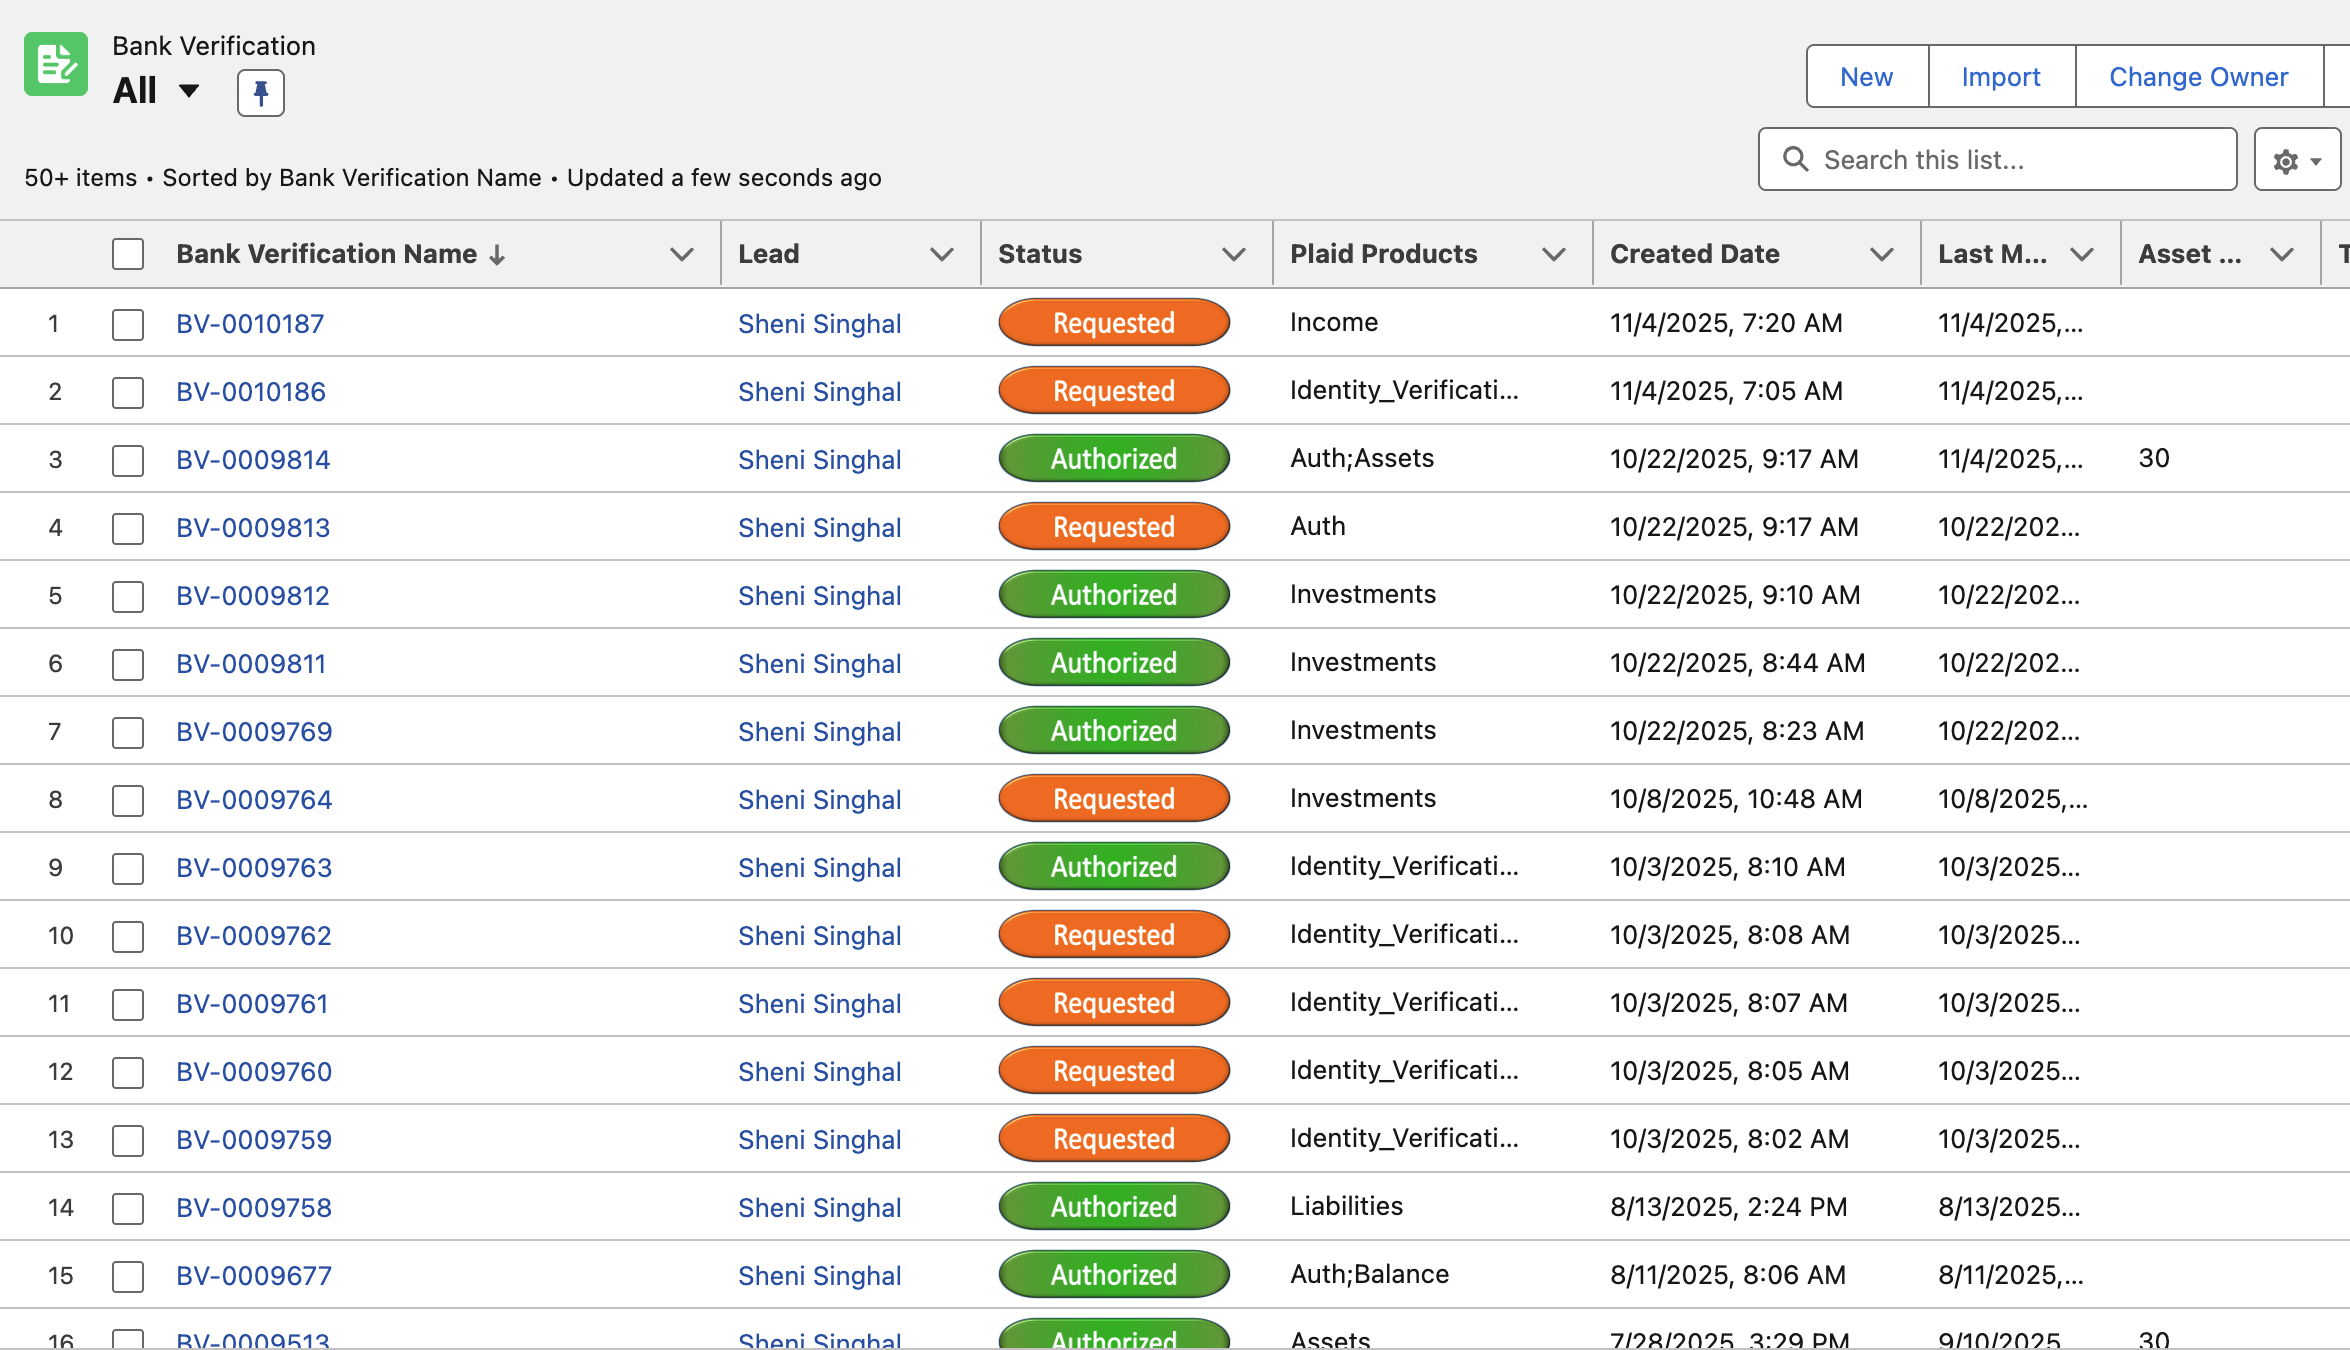
Select the Bank Verification record for which you want to view analytics.
-
Ensure that:
-
The Plaid Products field includes Assets.
-
The Asset Api Status field is set to Completed (indicating successful retrieval of data from Plaid).
-
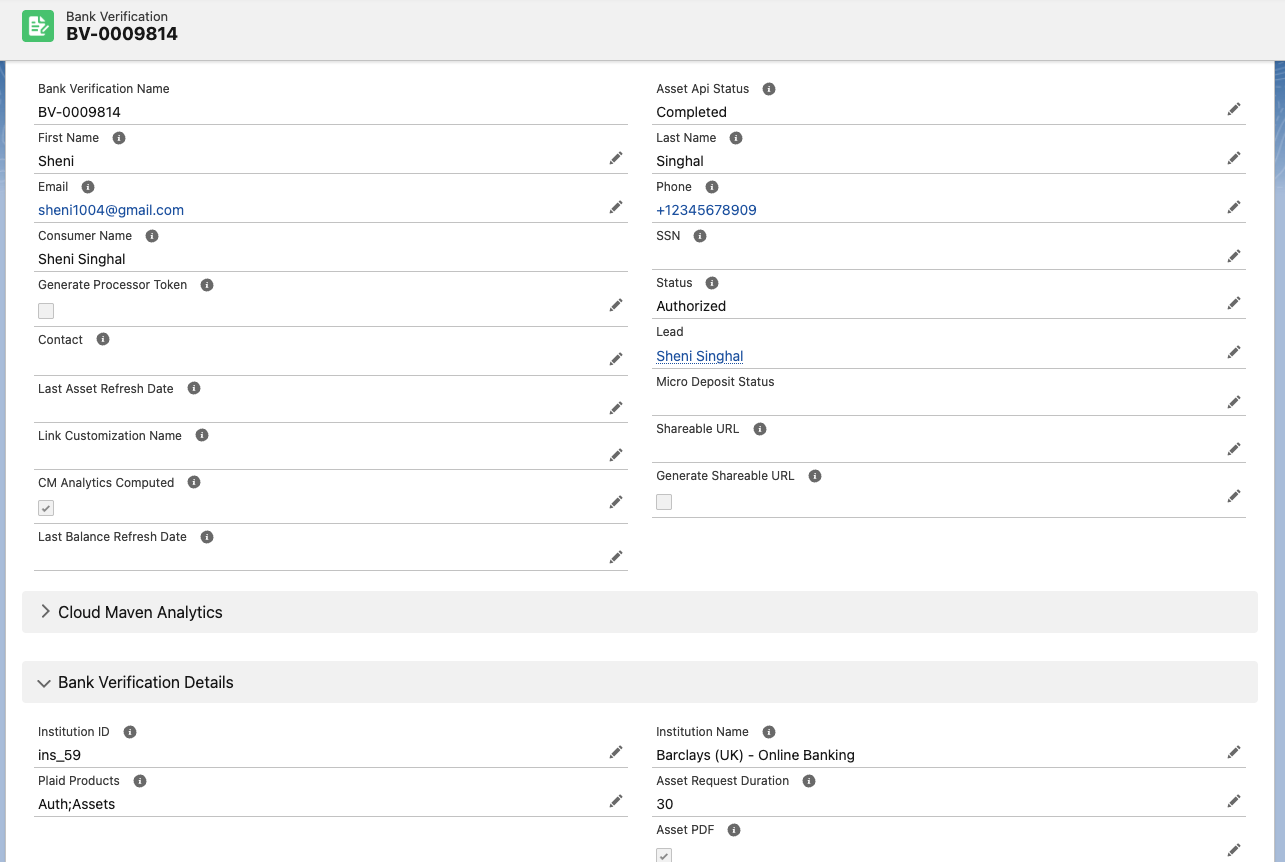
If the record Asset Api status is not “Completed,” the Cloud Maven Analytics tab may not display any calculated data.
The User will see “No Related Bank Verification Record Exists” text.

Step 2: Navigate to the Cloud Maven Analytics Tab
-
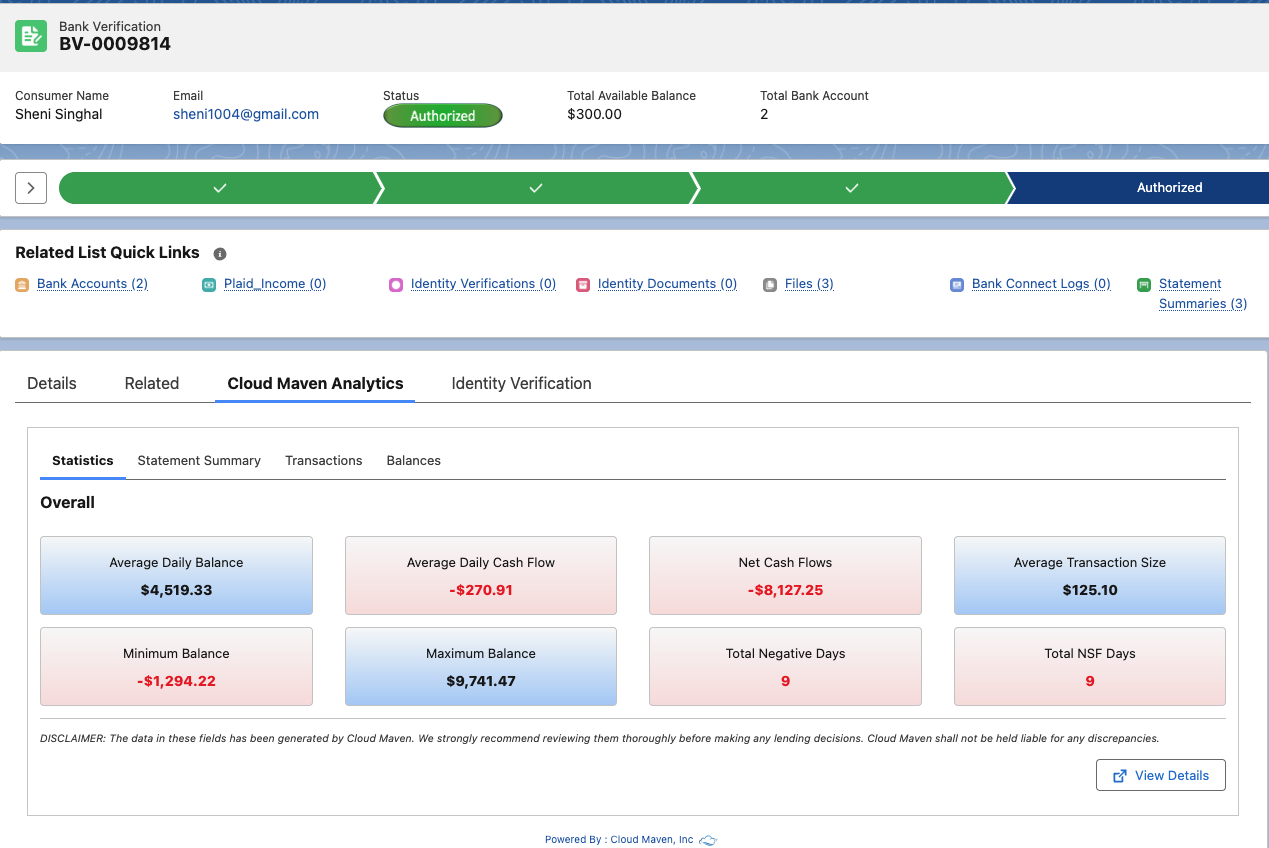
Within the Bank Verification record page, locate the Cloud Maven Analytics tab in the related list or subtab section.
-
Click on it to access the analytics interface.
-
The interface contains four sub-tabs:
-
Statistics
-
Statement Summary
-
Transactions
-
Historical Balances
-
3. Understanding the Cloud Maven Analytics Sub-Tabs
3.1 Statistics Tab
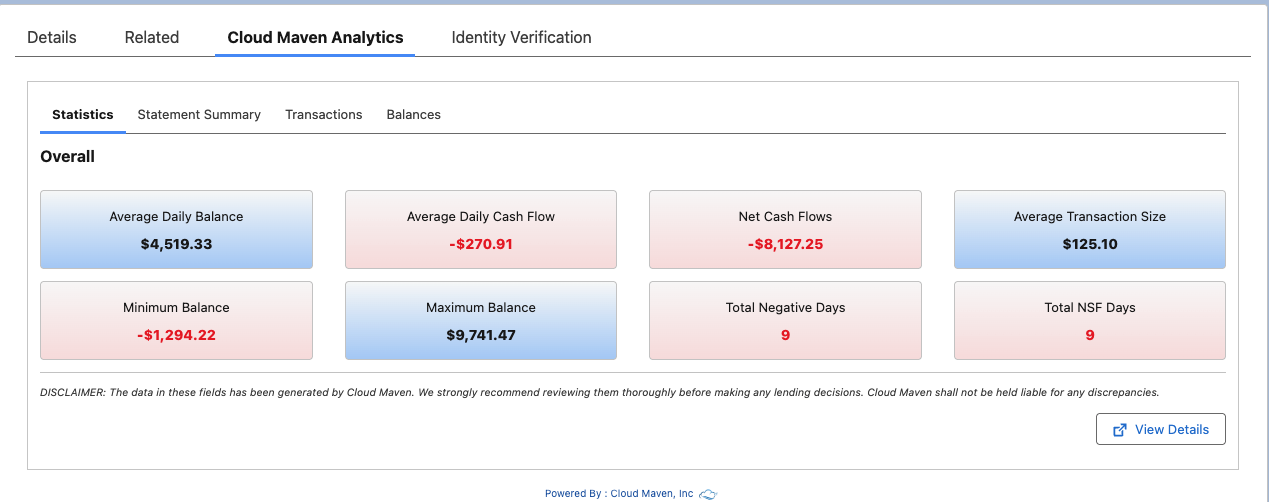
This section displays key financial indicators calculated from the Asset Summary received from Plaid. The values represent derived insights rather than raw data, computed using predefined formulas.
Common attributes include:
-
Average Daily Balance – Average of daily end-of-day balances for the selected period.
-
Maximum Balance – Highest end-of-day balance observed.
-
Minimum Balance – Lowest end-of-day balance observed.
-
Average Daily Cash Flow – Average inflows and outflows calculated per day.
-
Net Cash Flow – Total inflows minus total outflows.
📘 Reference: For calculation logic and more details, refer to the Confluence page:
https://cloudmaven.atlassian.net/wiki/external/MmE3NzVmZmM2OTA1NGY2YTg0ZjRmZDFhZWRmN2JhOGE
3.2 Statement Summary Tab
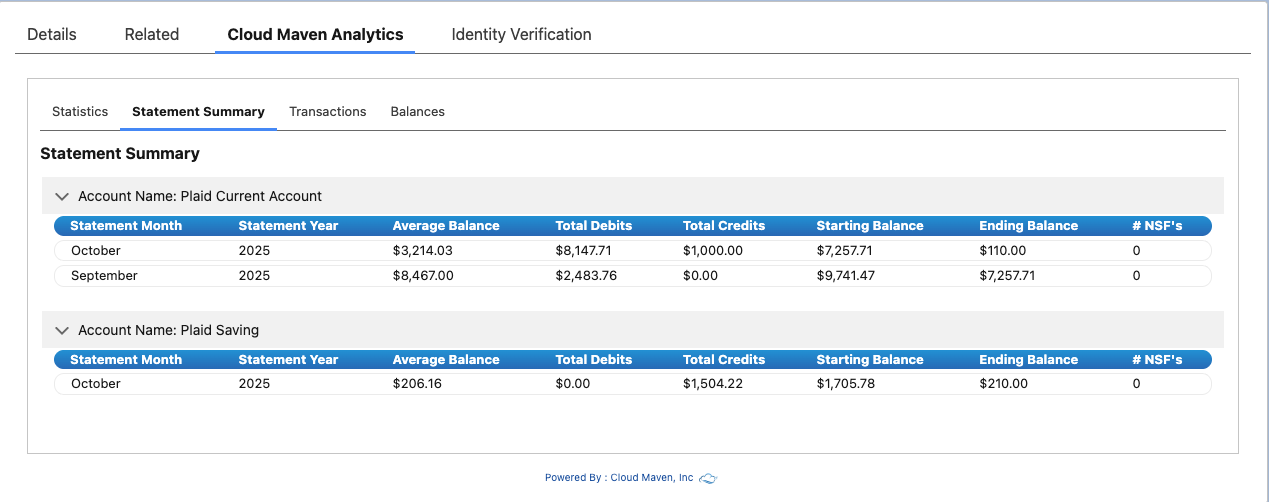
Displays summarized financial data per Bank Account per Month, providing an at-a-glance view of monthly account performance.
Each row corresponds to a unique month-account pair and includes:
-
Starting Balance
-
Ending Balance
-
Average Balance
-
Total Deposits (Count & Amount)
-
Total Withdrawals (Count & Amount)
✅ Tip: Use this tab to compare month-over-month trends for liquidity and account activity.
3.3 Transactions Tab
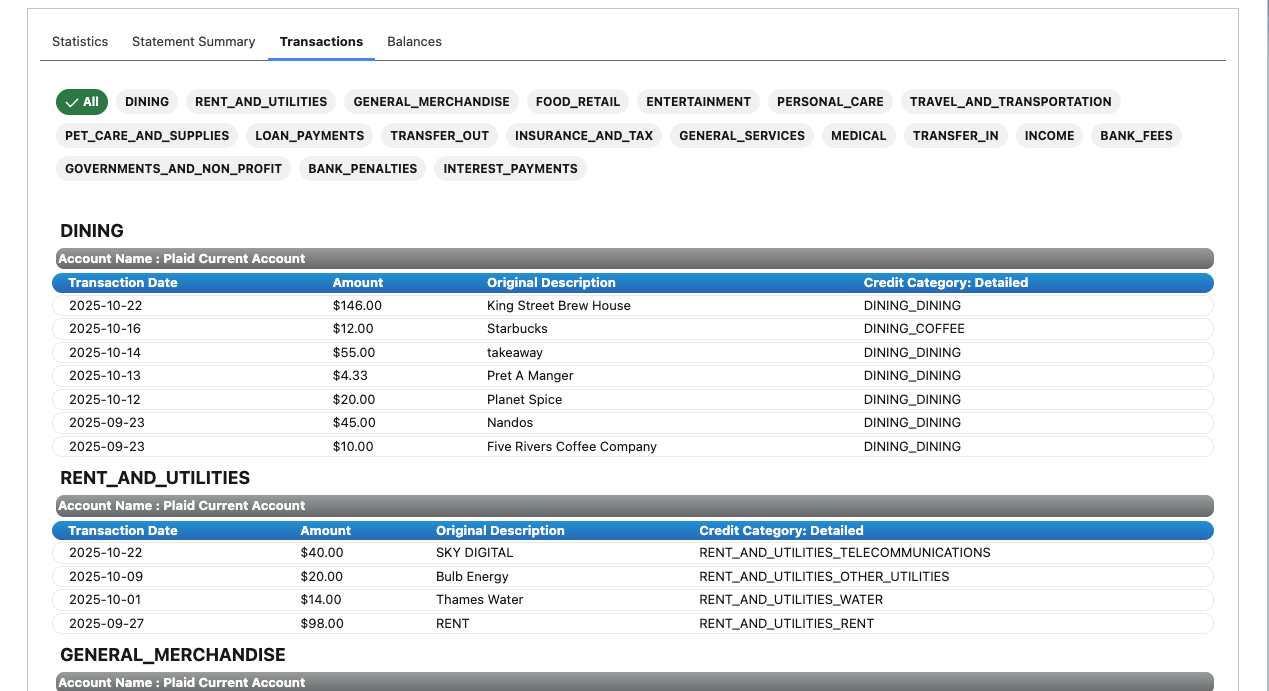
This tab provides a detailed list of all transactions associated with the child Bank Accounts linked to the Bank Verification record.
Features include:
-
A complete list of transactions (debits and credits) categorized automatically.
-
Category Pills: Displayed above the table; clicking on one or multiple pills filters transactions by those categories.
-
Each transaction record typically includes:
-
Date
-
Description
-
Category
-
Amount
-
Transaction Type (Credit/Debit)
-
Associated Bank Account
-
🧭 Usage Tip: Filter by “INTEREST_PAYMENTS”, “MEDICAL”, or “TRANSFER_OUT” to quickly focus on specific financial behaviors.
3.4 Historical Balances Tab
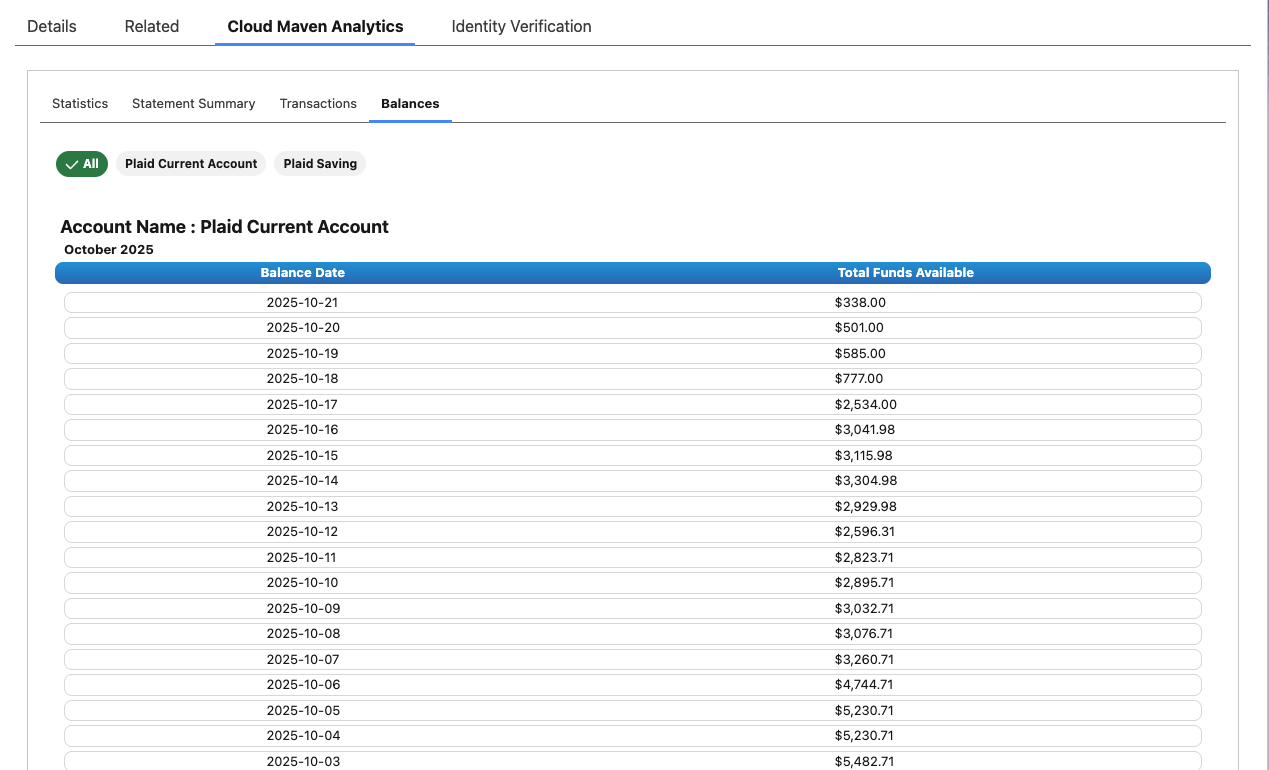
Provides a visualized timeline of account balances over time.
Displayed fields:
-
Date – The calendar date of each balance entry.
-
Ending Day Balance – The closing balance for the given day.
-
Bank Account Filter: Users can select one or more Bank Accounts via pill filters to refine the display.
Use this view to analyze balance fluctuations and detect patterns such as consistent overdrafts or daily high variance.
4. Configuration – Custom Metadata: PDF Analytics Configurations
The order, visibility, and display labels of fields across the four sub-tabs are fully configurable via Custom Metadata. Admin users can tailor the analytics view to match organizational requirements.
|
Analytics Section |
Metadata Record Name |
Description |
|---|---|---|
|
Statistics |
|
Controls display and order of calculated financial metrics. |
|
Statement Summary |
|
Manages fields related to monthly summaries. |
|
Transactions |
|
Determines transaction fields and display order. |
|
Historical Balances |
|
Configures displayed fields for daily balance history. |
To update field configuration:
-
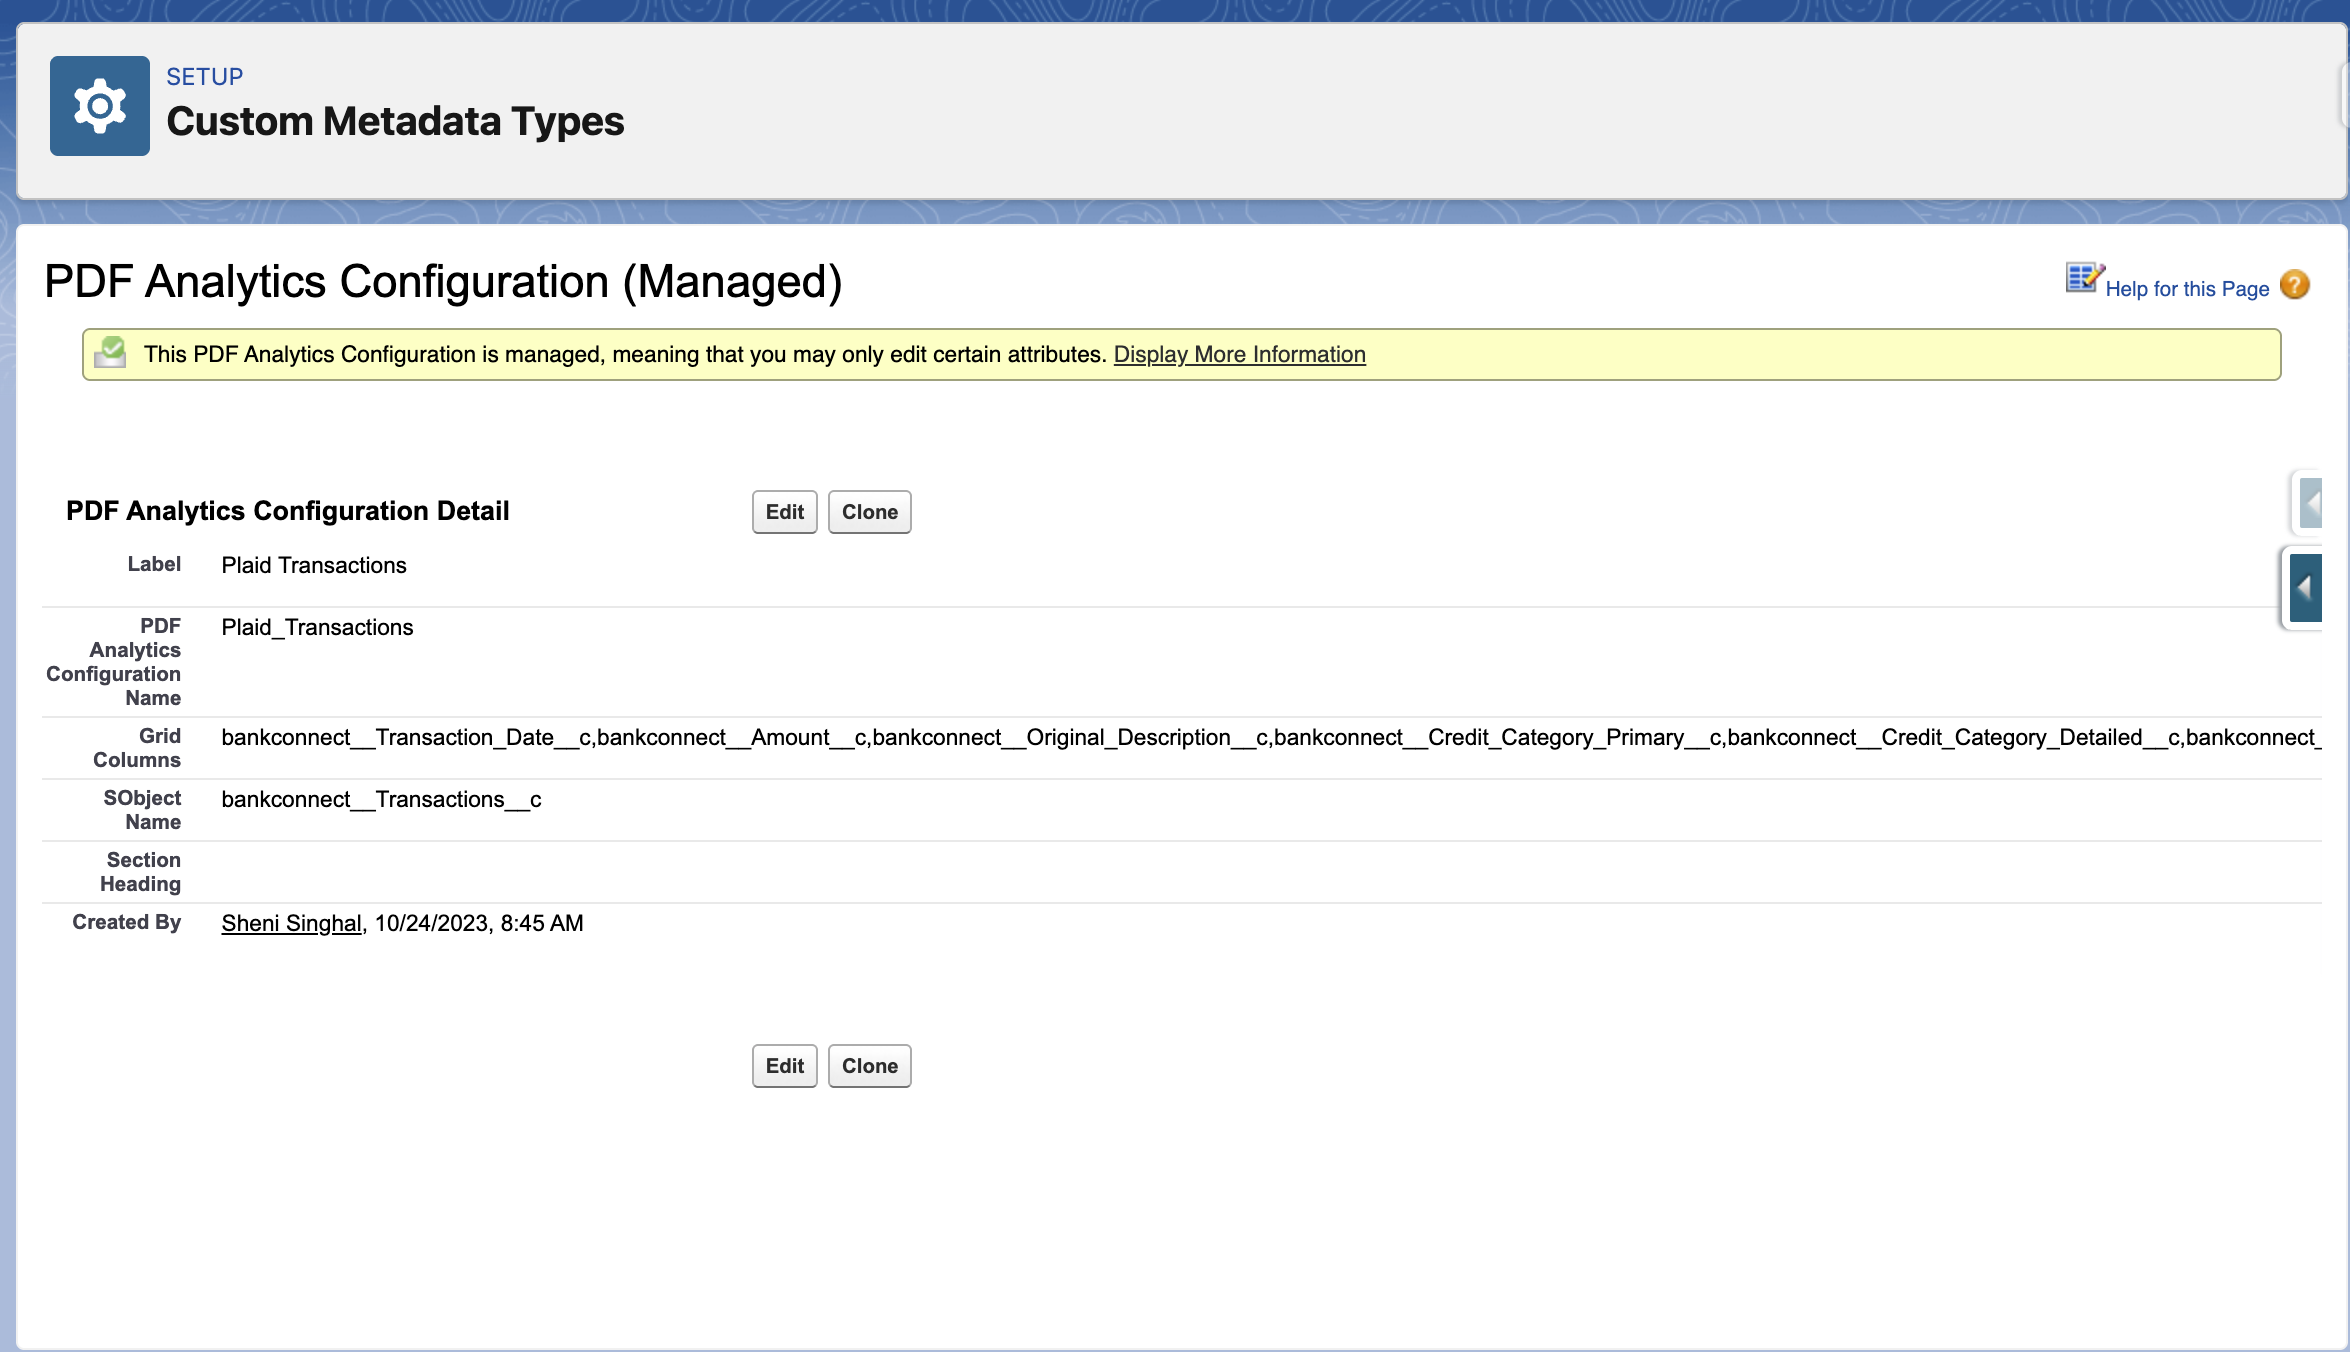
Navigate to Setup → Custom Metadata Types → PDF Analytics Configurations.
-
Select the appropriate record (e.g.,
Plaid_Transactions). -
Modify the order and visibility using “Grid Columns” field.
-
Save and refresh the Analytics page to view the updated configuration.
Changes to metadata configuration apply globally across all Bank Verification records.
5. Example Use Case
A Loan Analyst reviews a completed Bank Verification record for a potential borrower:
-
Opens the Bank Verification record (Asset Api Status = Completed, Plaid Product contains Asset).
-
Navigates to Cloud Maven Analytics.
-
Reviews:
-
Statistics for overall financial health.
-
Statement Summaries for monthly liquidity insights.
-
Transactions to check for irregular spending or overdrafts.
-
Historical Balances to ensure account stability over time.
-
-
Filters transactions by “TRANSFER_IN” category to assess consistent cash inflows.
6. Summary
The Cloud Maven Analytics dashboard empowers users with real-time, data-driven insights into customer banking behavior. By integrating Plaid data and configurable metadata, users can visualize trends, assess risks, and customize their analytics experience effortlessly.
This tool ensures that key financial indicators are accessible and interpretable in a standardized, user-friendly interface.